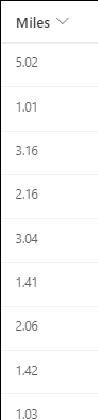
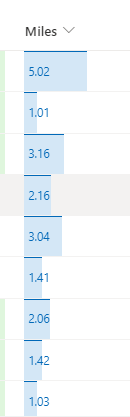
Display numbers like bar charts in SharePoint list column. 1: Select the column header>Column settings>Format this column 2: Select switch to design mode if not in design mode, select Edit template to customize (optional) 3: Save without customizing or after customizing
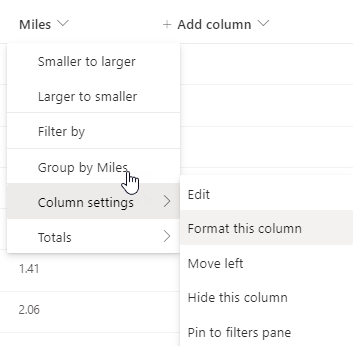
Select the column header>Column settings>Format this column
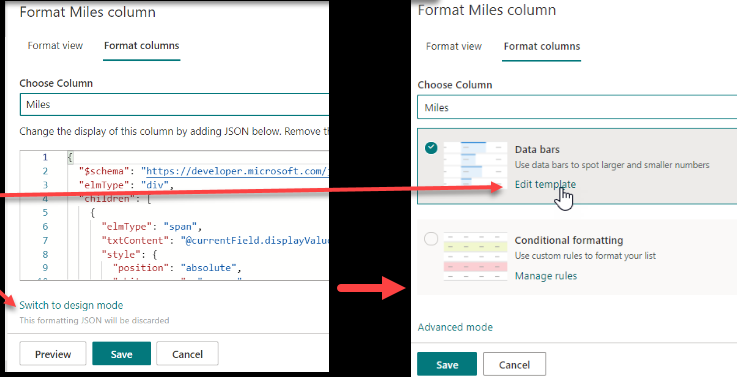
Select switch to design mode if not in design mode, select Edit template to customize (optional)
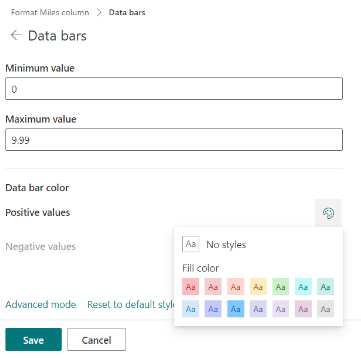
Save without customizing or after customizing
Check back for more SharePoint Online tips and also follow me on twitter @nader2015